Chapter 3 Basic Model Operation
3.1 The first model run
Start POSEIDON by running on terminal:
You will be greeted by the scenario selection window:
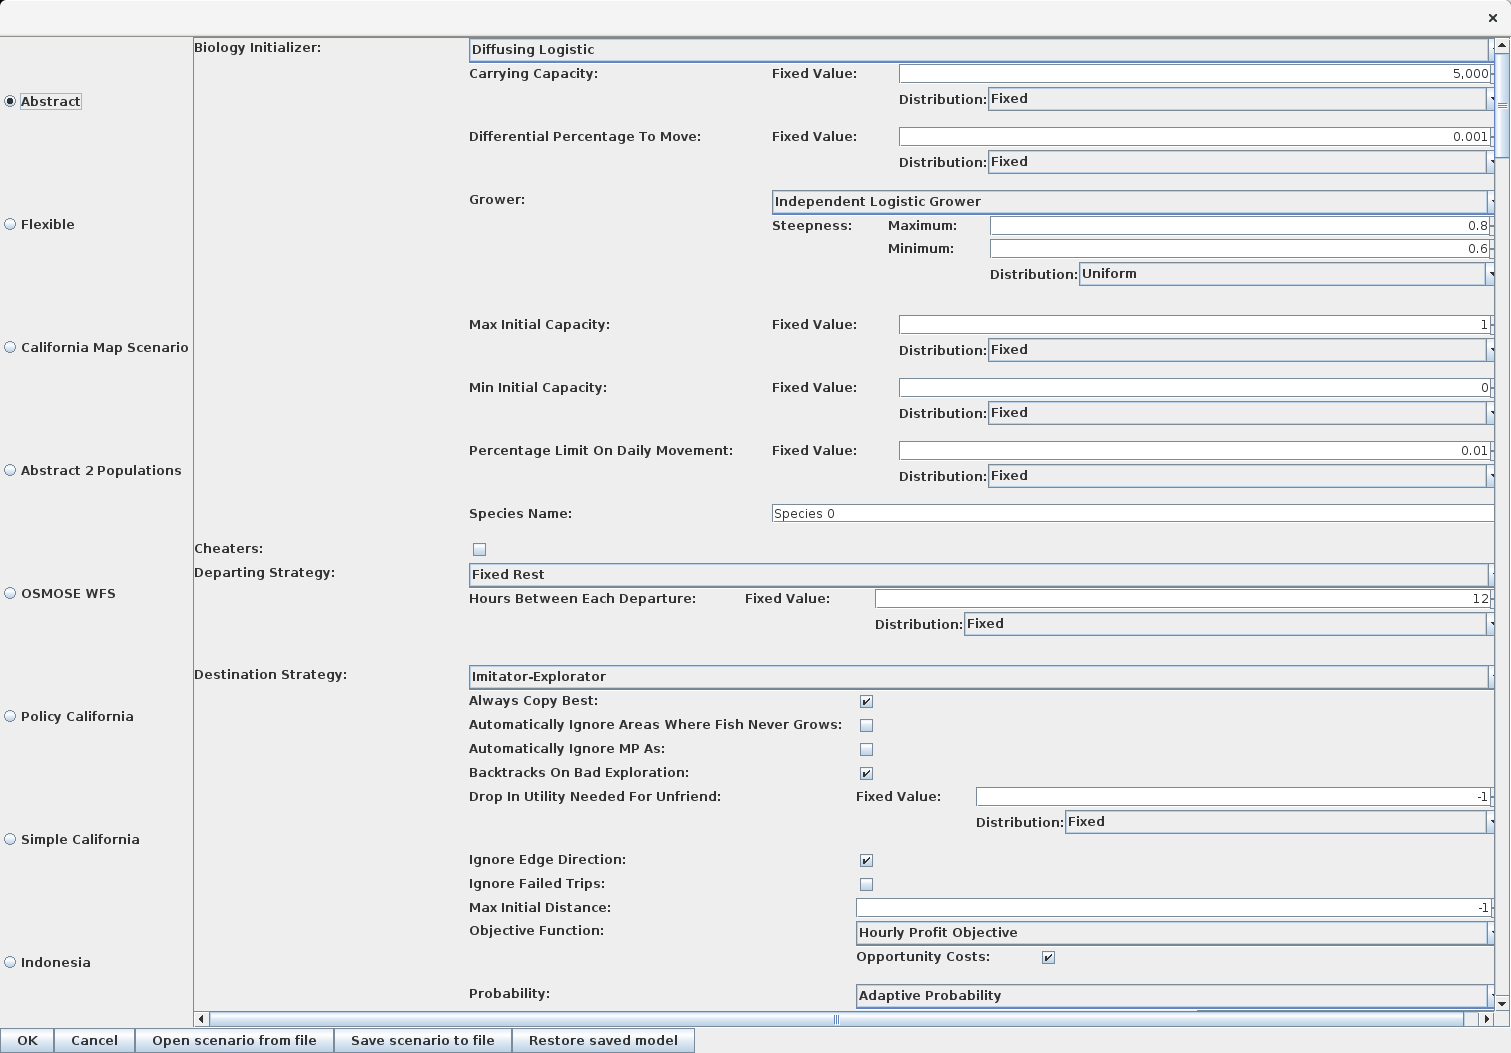
Keep the default scenario settings and press the OK button. The scenario selection dialog will disappear and be replaced by the controller window (which you should be familiar with if you have ever done any other MASON modelling)
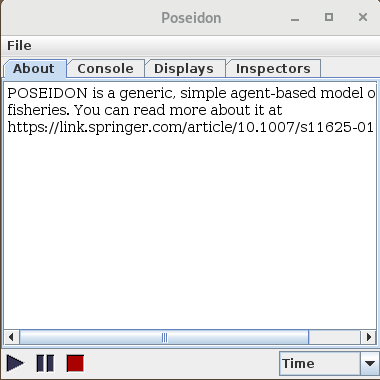
There are 3 buttons on the bottom left corner: play  ,
,  , and
, and  . Pressing
 stop at any time will close the simulation and return to the scenario selection dialog. Pressing either play or pause will start the simulation. play will start the simulation and run it, while pause will start the simulation but wait for user input before doing anything else.
Press to start the simulation.
When the simulation starts, a second window will open containing the bathymetry of the simulation. Green areas represent land, blue areas represent the sea (the darker, the higher the depth). On the top-right corner you can change the mode of the bathymetry to show other geographical information. In the default abstract scenario there is a single species of fish (Species 0) randomly dispersed. As shown below we can check where it is more prevalent on the bathymetry (the darker the areas the more fish is in that cell).
3.2 POSEIDON in motion
Press to run the simulation. Let’s run it for a couple of simulated years. The simulated time is written down at the bottom of the controller.

If you look at the bathymetry you can see something like this unfolding:
This the “fishing front” behaviour we described in the paper. Basically fish is uniformly distributed but travel is expensive so agents quickly learn to fish near port for maximum profits. However these areas are consumed quickly and fishers fan out away from the port as time goes by.
You can get investigate the effect by looking at the biomass layer to see that areas close to port are indeed depleted:
3.3 Tracking and Inspecting Agents
If we want to track a particular boat over time we can single click it in the bathymetry simulation and we will be able to see its path as the simulation progresses.
Press , single click on a boat and then press again to see its motion. Single click on an empty cell will turn off the tracking.
We can also look at the variables of each agent to understand their behaviour. If we double click on a boat we can use the inspector tab to check its variables and understand its behaviour. These variables will update as the simulation continues.
Press , double click on a boat and then look for its name in the Inspectors tab of the controller (it will say some variation of “Fisher X”). You will be able to look at all its variables (in alphabetical order) underneath.
A particularly important set of variables are Daily Data and Yearly Data. These are the data collected by the individual fisher over time both for decision making and for us to monitor. Its variables are shown as buttons and clicking on any of them will open a time series describing its progression.
Running the model while inspecting the variables of many agents is computationally expensive. When you are done observing, press Empty List to speed up POSEIDON.
3.4 Aggregate Data
As we have seen, agents hold some data objects we can observe in the form of time series. The model itself is also collecting data on the whole fishery. These can be accessed in the Aggregate Data section of the controller.
You may save the data to file by pressing to csv just next to the data button or you can save the time series image directly by right clicking on its picture and saving to PNG.
3.5 Fishing Fronts
Run the model for about 10 years.
Look at the Average Distance From Port daily aggregate data. It will clearly show (after the initial noise due to random starting conditions) a clear trend of fishing further and further out.
Similarly, look at Average Last Trip Hourly Profits. You will see that the profitability of fishing decreasing steadily the first year and settling into a permanent low.
However if you look at Biomass Species 0 you will see that the amount of fish in the sea has actually increased over the years.
A quick glance at the bathymetry will reveal the problem. Areas far from port are brimming with fish, areas near port are depleted. While Average Hours Out is steady through the years, Effort (which in POSEIDON refers to actual hours fishing) drops by year 2. That is, fishers spend a lot more time travelling back and forth instead of fishing.