Chapter 6 Different behaviours
6.1 Strategies
The whole point of POSEIDON is to be flexible, both in terms of environment and policies but also in terms of fishers’ behaviour.
Agents behaviour is defined by their Strategies of which the most important are the following three:
Destination Strategy: how do agents choose where to go fishDeparting Strategy: how do agents choose when to start a new tripFishing Strategy: how do agents choose when it is time to stop fishing
These are usually complex parameters, some depending on equally complex sub-parameters but in a way it has to be so if we want to capture complicated decision processes.
6.2 Change Destination Strategy
Destination strategies represent the way agents choose where to fish. There are very many of them and there is a paper that describes and test their effectivness. You can read a pre-print version here.
The default destination strategy is the explore-exploit-imitate agent. It is simple, in the sense that it involves a fixed exploration rate coupled with imitating better competitors when connected through a social network (see paper).
It has however a lot of parameters governing a few of its details:
 These includes:
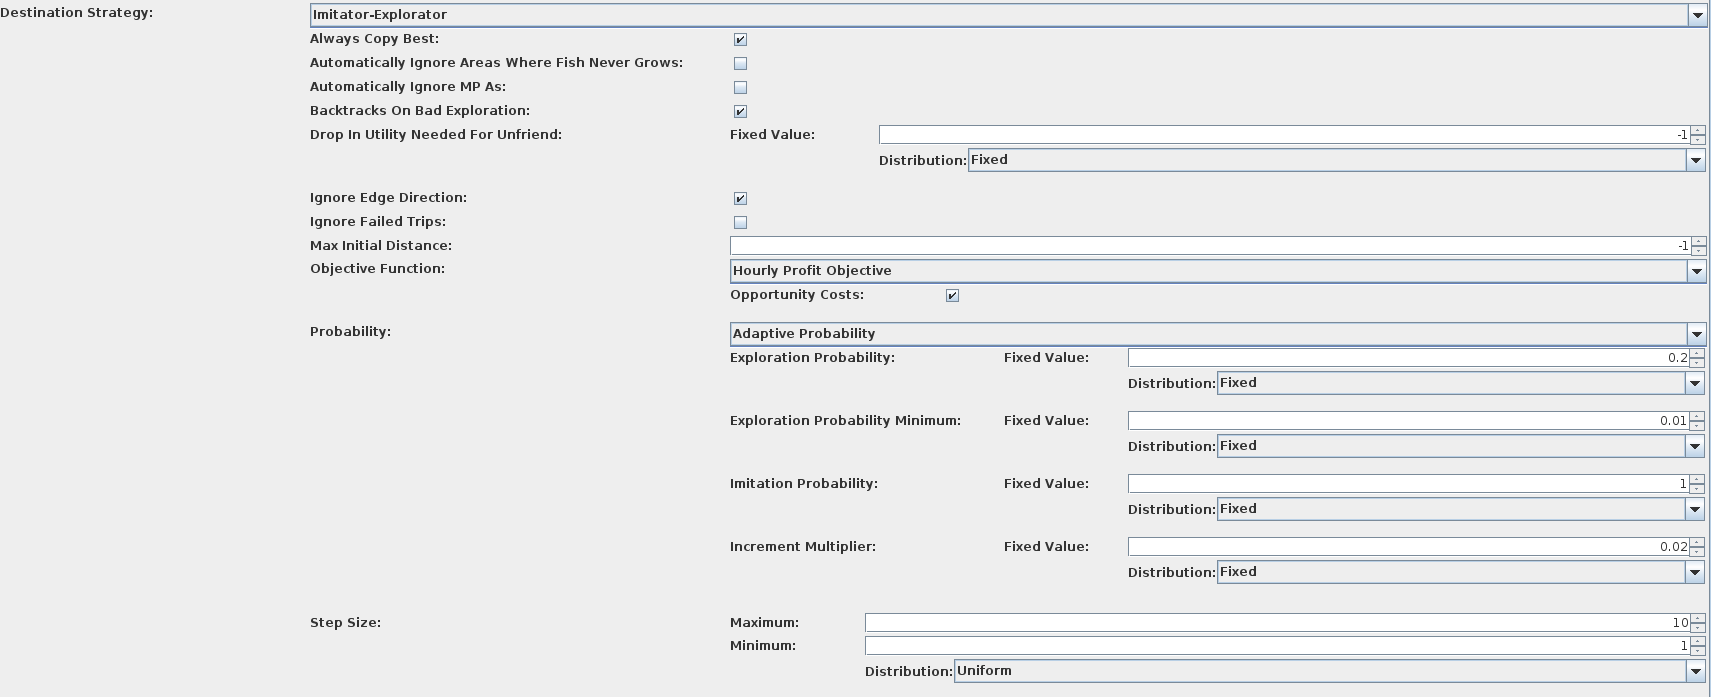
Always Copy Best: when imitating, should I copy the best friend I have or any friend who is doing better?Automatically Ignore Areas where Fish Never Grows: agents never explore areas where fish can’t growAutomatically Ignore MPAs: agents never bother trying to catch in protected areasBacktracks on Bad Exploration: when an exploration make less utility, should my best spot be the place I’ve been before exploring?Drop in Utility Needed For Unfriend: if positive, what percentage of utility difference between what my friend experienced and what I experienced after copying before assuming they are an unreliable friend?Ignore Edge Direction: do I consider friends everyone who is connected to me or only direct connections in the social network?Ignore Failed Trips: If trips fail (because of weather, end of season and so on) should I consider them to judge whether the exploration was successful or not?Max Initial Distance: if positive, the very first spot fished will not be further than this from the fisher’s portObjective Function: the function I use to judge the quality of a tripProbability: what is the probability that next trip will be an exploration or, if not exploring, an imitation. Adaptive means that this probability will change over time as exploration is more or less succesfulStep Size: in cells, what is the neighborhood around my current location where I will explore, if needed
So that’s quite a lot of switches, although most likely all you really care about is Probability and Step Size.
6.3 Gravitational Search Algorithm
Now let’s change the behaviour of the agents to a different algorithm: GSA (you can read more in the paper above).
This is much simpler as it involves everyone sharing information with everyone else at all times. The idea is that imitation works as if fishers were planets pulling each other. Their gravitational mass is a monotonic function of profits made.
If we run the model with this behaviour algorithm you will see something like this occurring:
This is what I call, very scientifically, the conga line. It is a consequence of too much information sharing. It’s quite poor in terms of profits but it works really well when the fish is a big school moving about.
6.4 Heatmap algorithm
Another set of algorithms involve the agent building inferential maps of where they think they most amount of profits are.
You can select them easily as Heatmap Based as the Destination Strategy:
It is quite computationally intensive so it’s usually a good idea to set the parameter Proportion Searched in the Acquisition Function to 0.1; this is the % of cells sampled from the inferential map to choose where to go next.
The blue areas are considered “high profits”, white areas are mediocre and red areas are low profits.
This map updates as the model runs, but will do so slowly unlessEmpty List is called first to keep the model from processing too much information.